In order to view the reports of your survey, go to the Analyze section. The Analyze section can be reached from the Surveys tab by clicking on the survey card and choosing Analyze
Please notice that the language of the questions in the report is the default language you have set when first publishing your survey.
See the quick tutorial to the analyzing tool below:
HINT! Before you analyze the answers, you might want to close the survey. Learn here to do it.
The data can be filtered according to a specific time period by setting a beginning and ending date as well as according to choices of a choice type of questions. You can select the timeline by clicking a day, holding the mouse down and dragging over the days you want to select. Choices of the choice questions can be selected by clicking and holding shift.
You can unselect the selected days or options by clicking the options on the bottom of the builder.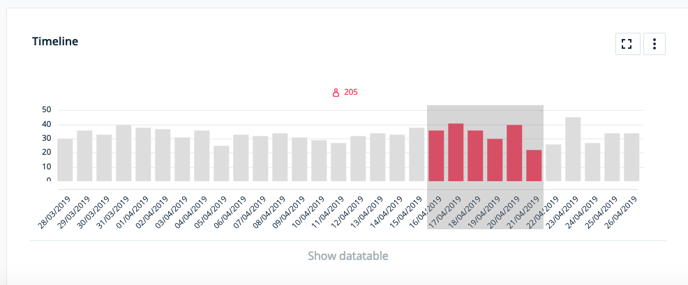
By clicking the three dots next to the title of questions, Edit, Merge chart with and Remove options will show up.
By clicking Edit, you can choose a wanted chart type by clicking Select chart type, define the wanted scale on part Scale of values and select if value is shown on part Show values.
By clicking Merge chart with, you can create custom charts from different questions and question groups.
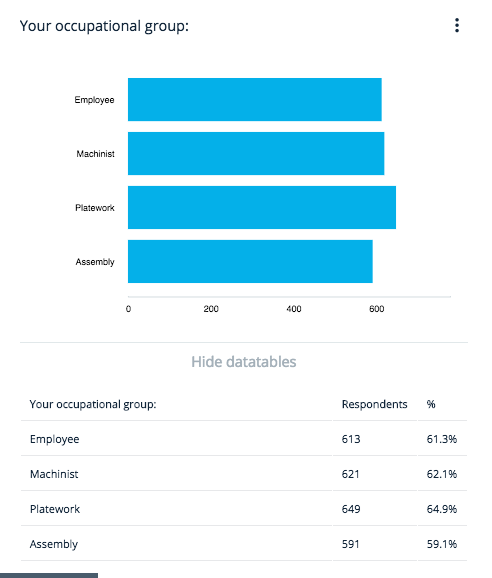
Under each question, there is a text Show datatable. By clicking the text, you will see how many respondents have answered in a specific way. These are also presented as percentages. You can hide the details by clicking Hide datatables.