
On the Analyze section of the tool, you can create different charts to visualize the collected data.
Summary Charts
See the summary of the selected questions in a single chart.
Heatmap
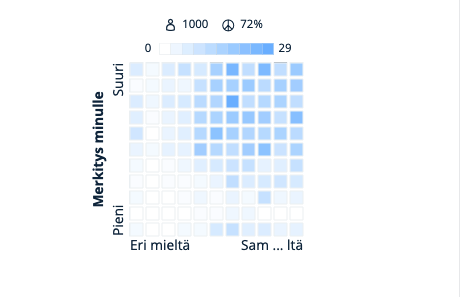
See how the answers are divided across the response area.
Column charts
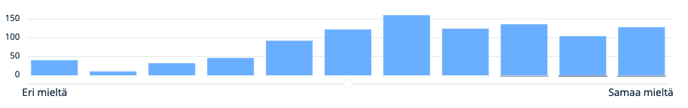
Compare easily answers using bar charts.
Line charts
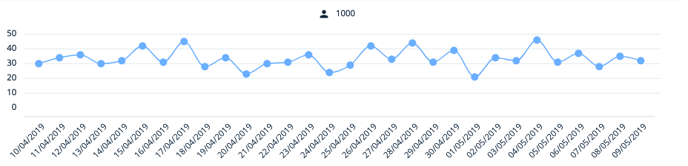
Discover trends or notice changes overtime with a line chart.
NPS
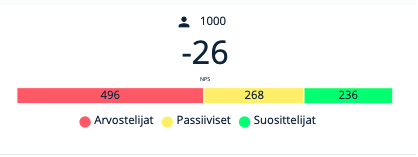

Track how loyal your customers are by measuring the NPS number.
Word Cloud
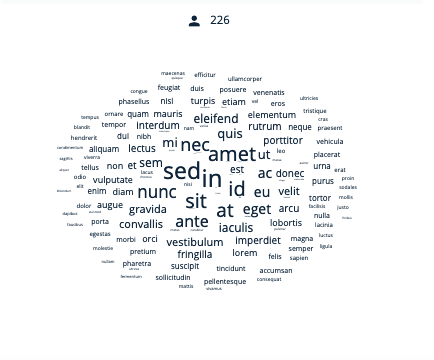
See the most commonly recurring words in collected free texts.
Radar chart

Compare multiple quantitative variables in one chart.