You can create different user segments based, for example, on the team information, city or answering date. Answers on different user segments can be analyzed on their own or compared with other user segments.
- Start by creating a new user segment by clicking the wanted answer options, groups or answering date to select the respondents, who pass those filters.
- Click Add to comparison
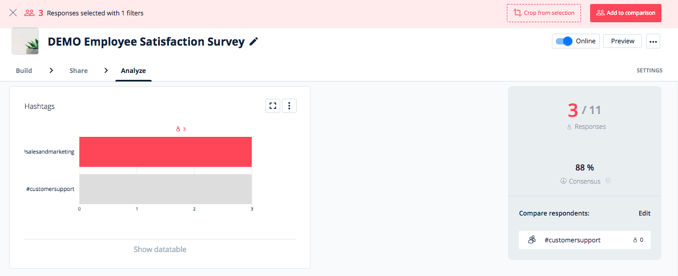
- You can edit the user segment -names by clicking Edit from the right hand side menu
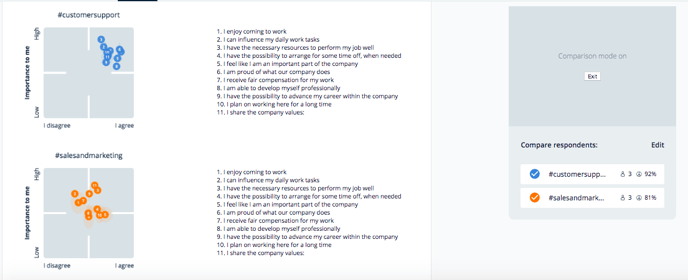
- You will get the comparison view by clicking the user segments on the right. Then user segments are shown in the report view with different colors:
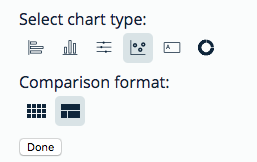
If you want to create a chart with all of the different user segments, click the three dots on the upper right corner of the chart page. Click then Edit, Joined tables and Done.
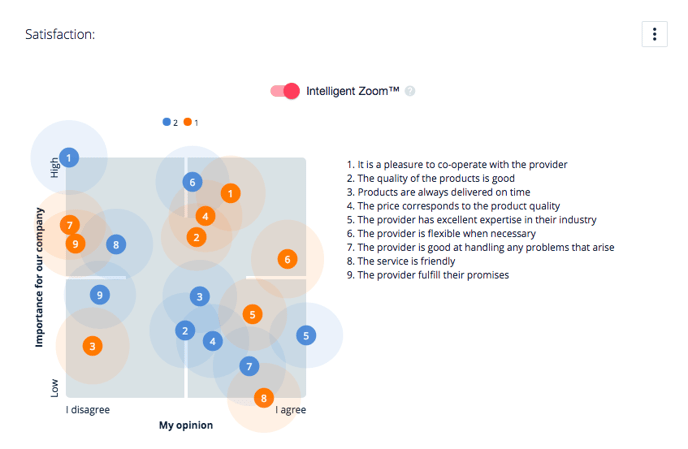
For example, a 2D question with two user segments could look like the following: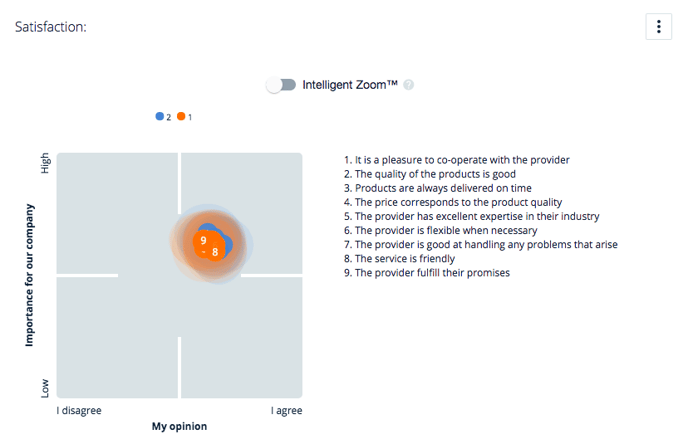 When the Standardize scales feature is on, the chart looks like the following: